In the years after the pandemic, the United States has seen the percentage of chronically absent students skyrocket from the pre-pandemic rate of 12.1 percent in 2018–2019 to roughly 25 percent in 2022–2023.
According to the Los Angeles Times, California has among the highest increases in absenteeism in the country. In the last four years alone, these percentages have translated to more than one million additional chronically absent students.
For students on a typical 180-day school calendar, missing 5–10 percent of the school year can amount to nearly a month of missed class time.
On any given day at Branson, a steady stream of students fills the Quad between blocks, seniors transit on and off campus at lunch, and athletic events consume our afternoon schedules; however, among this daily flow, absences and tardiness fluctuate day-to-day due to a myriad of forces. So, just how real is the “absenteeism effect” at Branson?
Just because we could, we did a little digging (OK, maybe too much digging) into these trends, the main concerns and possible solutions. With the help of Catherine Pedneault, Branson’s programming and operations coordinator, countless spreadsheets and some fancy data story-telling, we found that the answer (like pure number-crunching) is complicated.
Method 1: Looking at Absences, Tardies and Early Releases By Reason
As you might guess, Branson’s absenteeism is not affected by a single factor, but rather a range of them.
Over 83 days in the fall semester, we identified a total of 1,992 logged absences, 812 tardies, 116 early releases, and 355 other special cases across all four grade levels. To keep it simple, we will just call these all observations.
With observations ranging from an “art class field trip” to a “pickleball tournament” and even “did not know about room change,” standardizing the dataset was much needed (thank you, Wilson for doing this by hand!). After some crafty lines of code, these observations were filtered across 13 generic categories.
Starting with the selection of fall and winter sports, soccer excused the highest number of recorded absences (292), nearly twice the amount as that of tennis, basketball and football combined, which followed behind respectively. Branson soccer expectedly accumulated the most sports-related observations as both boys’ and girls’ seasons started earlier in November this year than in previous years. Surprisingly, more than 78 percent of these soccer absences excused students from one to four block classes, with out-of-school tournaments and earlier games having the greatest effect.
Interestingly, 185 “did not sign in” observations were recorded as well. If averaged across the entire semester, about 2.2 students a day forgot to sign in at the library or in Richardson Hall.
Cited as the most common reason by far for tardiness in the morning was traffic.
“While arriving late to school may be out of someone’s control due to heavy traffic […] and issues with the bus, chronic tardiness due to traffic is a serious problem for students who provide their own transportation,” Pedeault wrote in an email. “We all know that there will be traffic every day. It would be a good idea to plan ahead and leave home earlier.”
Verdict so far: Promising for the absenteeism effect. Absences, tardies and early releases are largely influenced by sports, non-school events and traffic. On an average day, these observations account for at least 10 percent of the student body missing some form of class, or 80 total missed class blocks a day.
If you are curious about the full breakdown of reasons for absence (we were too!), see the word cloud below.
Method 2: Looking at Sick Absences Over Time
With more than 532 absences (16 percent of the total observations) due to “sickness” alone, and at least one student out sick for each of the 75 days of the 83-day semester, Branson’s absences mimicked national trends.
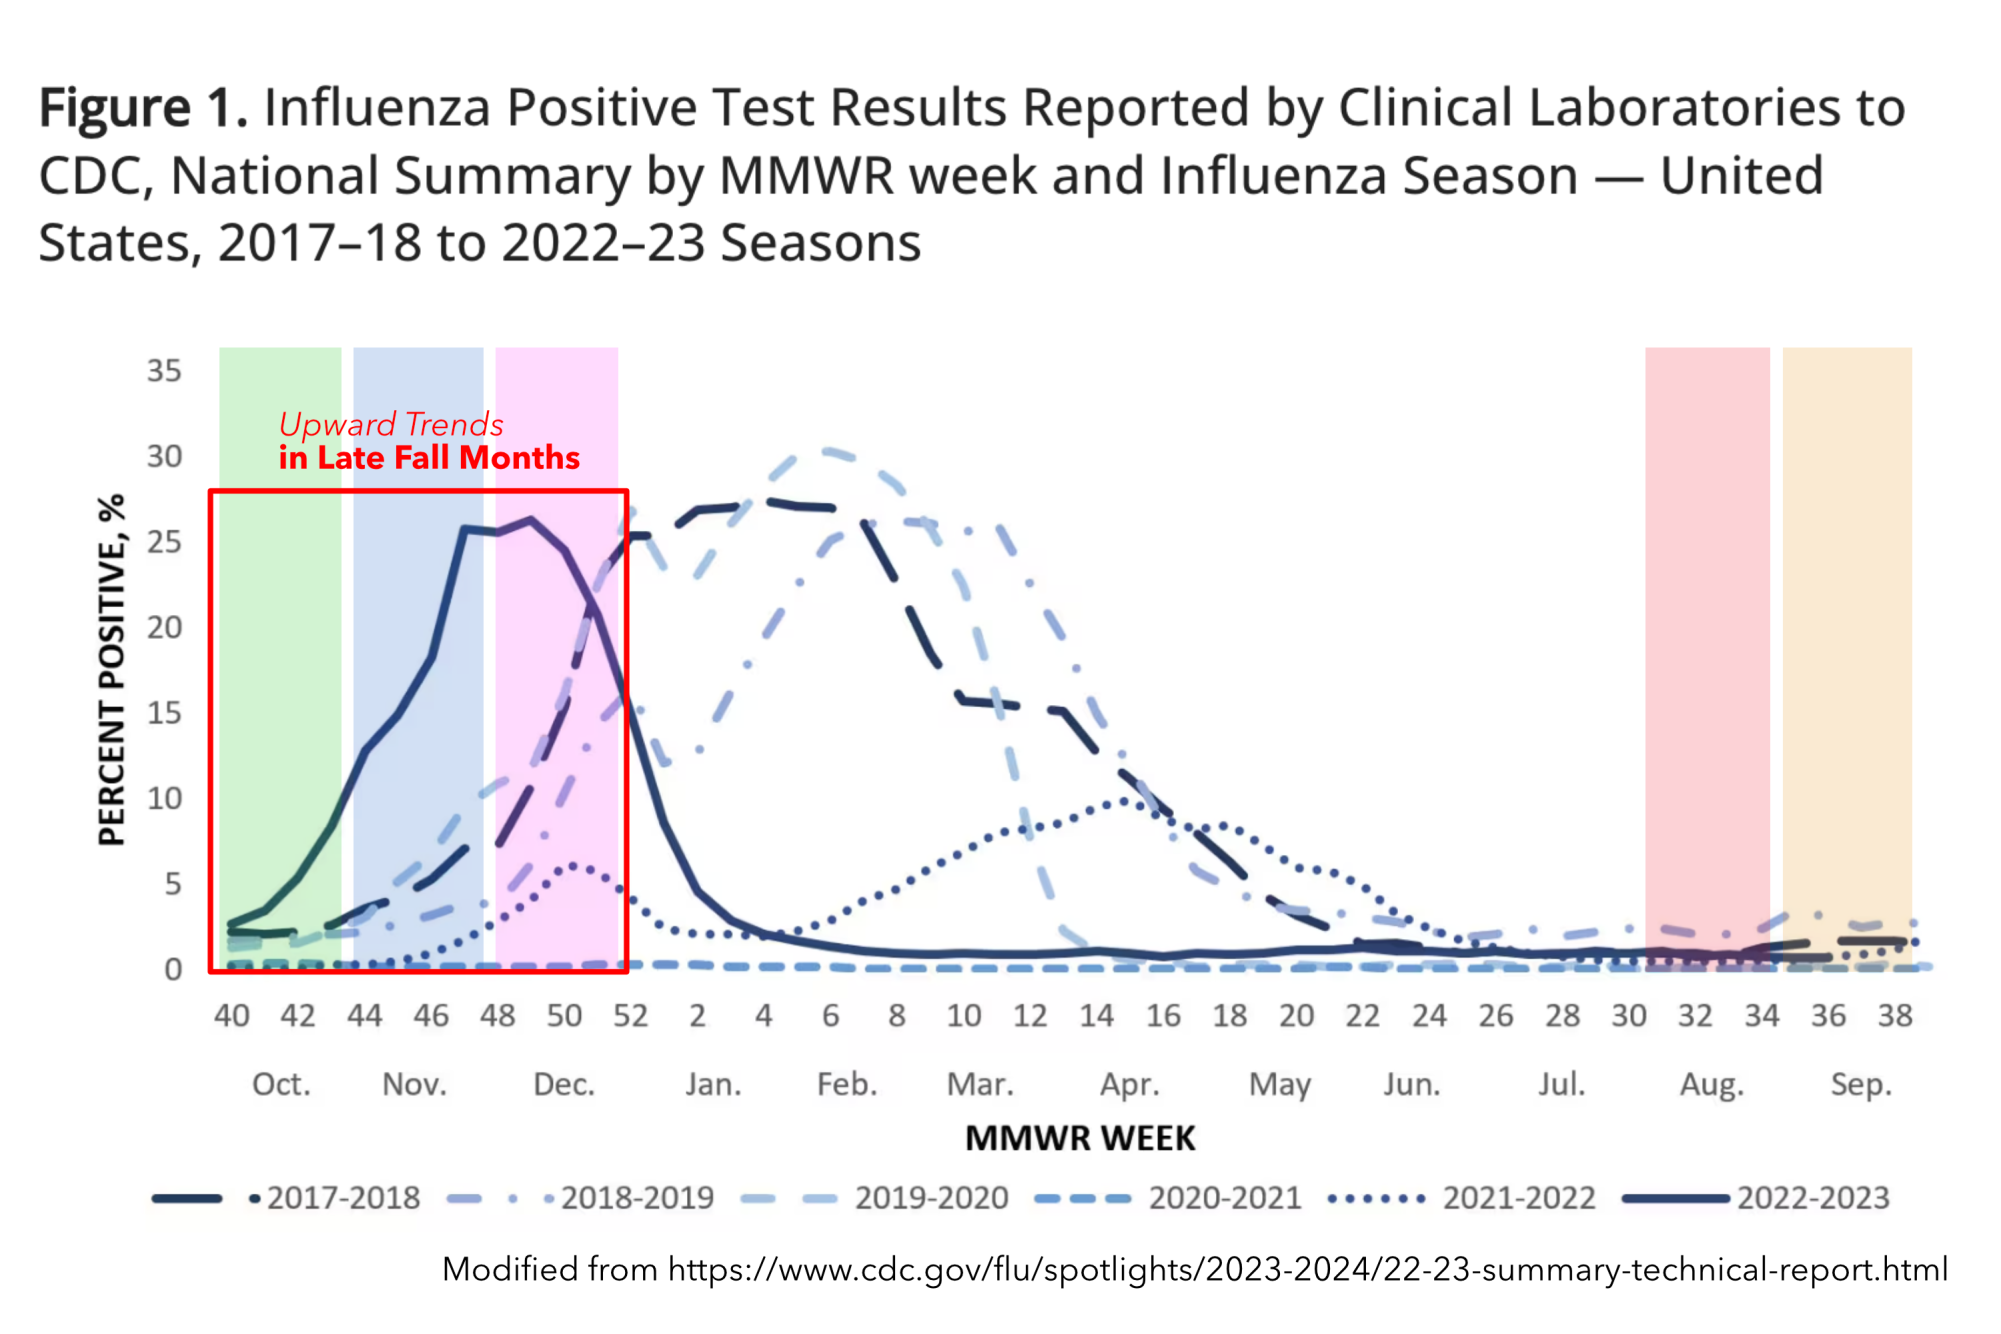
On any given day in the fall semester, the number of students out sick ranged from one to 19, averaging around 8.8 students per day. While this percentage rarely exceeded 5 percent of the student body, an increasing upward trend was easily noticeable in the later fall months. By November, the average number of students absent due to sickness nearly doubled what it was in September. With the colder months arriving, we wondered if the rise of the flu season played a role here.
When compared to positive flu test data provided by the Centers for Disease Control and Prevention from over the past six years, upward trends were indeed recurrently seen in the late fall to early winter months. Additionally, consistent peaking was seen in late November and December, just as our data demonstrated.
Furthermore, back-to-back three-day weekends such as Yom Kippur in September and the fall teacher work day in mid-October surprisingly matched upticks in sick absent students. The week after Thanksgiving break showed a similar increase as well.
Ignoring the possibility of external factors, student travel strongly correlated with these post-break upticks in sickness-related absences. As more students traveled during school breaks, their likelihood of getting sick also increased.
Verdict so far: Somewhat mixed. Although there are steady increases in the number of students out sick during the semester, a significant number of absences seem to be driven by uncontrollable public health trends, confounded by student travel. But just how much does travel affect these trends?
Method 3: Looking at Overall Attendance Across Time
Returning to our pie chart above, roughly 108 observations were due to family events and vacations, representing more than 3 percent of total observations.
When we tracked attendance across time we consistently saw the number of students absent or missing part of the day grow throughout the school week, with significantly more absences right before the weekend. As longer breaks approached, including three-day weekends and holiday vacations, this uptick was noticeably larger on the preceding Fridays.
“People tend to disregard the school calendar and elect to start their break early,” Pedneault wrote. For Thanksgiving in 2023, “28 students were absent the previous Friday, not including the students who came to school for part of the day and left early.”
During the last week of December, a larger than usual number of students missed the three days of school before winter break, with roughly 17 percent of the school body out that last Wednesday.
Interestingly, the Beloved Community event saw the greatest number of students (59) missing part of the day, nearly three times the mean number across the semester. An additional 16 students were absent despite it only being Thursday.
Verdict so far: Complicated for the absenteeism effect. School breaks, travel and even school events like Beloved Community Day have significantly brought down attendance more than once, but as far as we can tell, this tends to happen only during particular times of the semester and not periodically.
Method 4: Looking at Attendance By Grade
You may be asking by now, which grade had the highest number of absences by the end of the semester? Our answer: 10th-graders. While ninth-graders briefly had the highest amount in early September and 12th-graders took the lead most of the semester, 10th-graders clutched the “win,” coming out with a total of 541 absences.
The accelerated growth of 12th-grade absences from mid-September to November was likely affected by increased college visits during the fall college season and the introduction of senior privileges. As for the slightly greater number of 10th-grade absences, that remains largely unexplained. It could in part be due to the increased class size of 125 students, but then again, 9th-graders had the least number of absences, so who truly knows?
Verdict so far: Again, very mixed results here for the absenteeism effect. Despite periodic moments of differentiation, absences across each grade level have accumulated at relatively steady rates — expected for a school of our size and the diversity of student body activities.
What does it all mean?
Much like poring over equations and looking for hidden patterns, studying the full data leaves room for interpretation.
In certain moments, Branson has experienced similar trends of chronic absenteeism to those observed nationally, often due to uncontrollable factors. At the same time, while complicated by other variables, our attendance has also been influenced by many of the controllable things in our lives.
Absences, tardies and early releases will always be part of the day-to-day life of being a Branson student, and we acknowledge that. But, there are also moments where we can take a pause to reflect on what we, as a student body, can do to make the most of our class time — time to meet with our teachers, engage in thoughtful discussion, and continue to grow as good human beings. That purpose is something that no statistic, dataset or formula could ever encapsulate, but that we can wholeheartedly embrace.